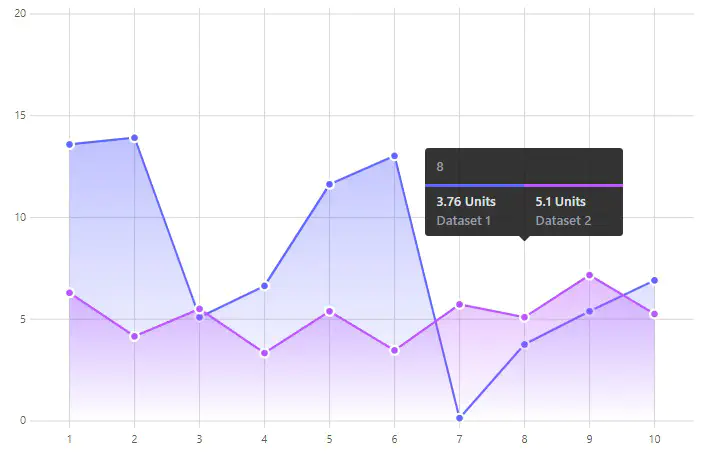
 An example gradient area chart
Frappe charts is a modern, open source SVG charting library written in javascript.
I had been reading John Coene’s Javascript for R, an excellent exposition into building widgets for R, and was inspired to put my new-found knowledge to the test. I selected the Frappe charts library as my use case and wanted to see how far down the rabbit hole I could go.
I was successful in porting over some of the charts and put them (very crudely) into a few R functions for use in Shiny, Rmarkdown and the viewer in R Studio IDE. I probably won’t flesh this package out further as it was for educational purposes.
Below you can find a sample of what it can currently create:
Nothing earth-shattering, but very satisfying in being able to do some of this myself rather than waiting for someone else to.