funnelR
 MMR Coverage
Ah yes, my first expedition into building an R package and having it submitted to CRAN.
install.packages('funnelR')
In retrospect, I’ve learned quite a bit since about package building, reproducibility and the need for tests. Many of which are absent here.
I’ve included this entry here as it served as a major milestone for personal development. It even made the Top 40 New Package Picks shortly after it was released.
I leave you with the vignettes to see what this package is all about. To give some context, in a previous role funnel plots were a staple of most statistical analyses involving our population-level data holdings.
The
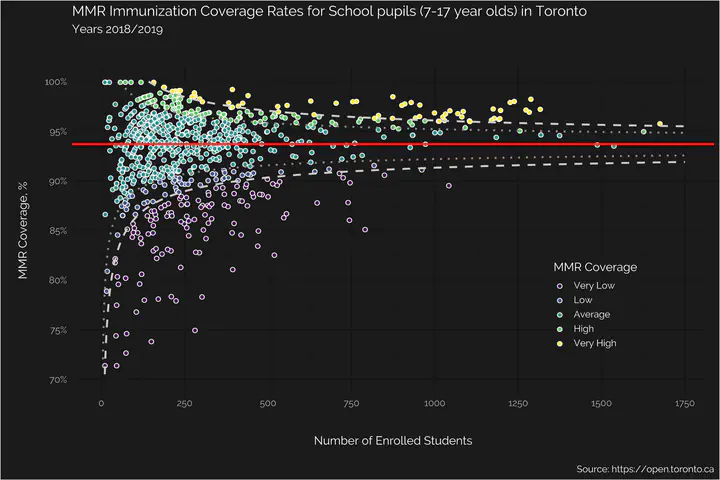
funnelRpackage provides a flexible framework for creating funnel plots for proportion data. A funnel plot is a powerful visualization in the analysis of unit level performance relative to some criterion. It readily allows identification of units that areIn ControlorExtremeaccording to a benchmark at a specified level of confidence (e.g.95%).
Framed this way, a funnel plot can be applied to any number of fields of study to monitor and identify units that deviate from what is considered typical. For example, it could be used to differentiate schools that are high, average or low performing on a standardized test according to a National or State benchmark. From a quality improvement point of view, they might help identify which hospitals have extreme mortality or surgical complication rates relative to a benchmark prescribed by a government body.
The funnelR package provides many options to specify elements of a funnel plot including user defined: control limits, benchmarks, and estimation methods. It also has the capability to write scored results (i.e. a variable that records whether a unit is In Control or Extreme according to the specifications of the funnel plot) to your sample data set. This variable might then be included in further analysis such as cross-tabulations (e.g. stratification) or regression modeling (e.g. covariate).
While many flavors of funnel plots exist (rates, ratios, etc.), the current package considers funnel plots assuming proportion data that is binomially distributed. The interested reader is referred to Spiegelhalter (2005) for further details.
If you’re interested in a specific use case (the one highlighted in the banner), I got you covered
If you want to see more flavors, I turn you to the FunnelPlotR package which is more comprehensive in types of analyses covered and actively maintained.