Matthew Kumar
Matthew Kumar
About
Projects
Blog
Talks
Publications
Light
Dark
Automatic
Data Visualization
QR Codes
Generating and using QR codes in R and Shiny Apps
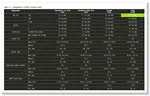
Dynamic TLFs
Exploring dynamic and interactive TLFs using Tplyr and reactable via Quarto
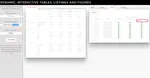
Linked TLFs
Using Tplyr and Shiny to create interactive + linked tables, listings and figures
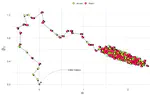
Visual MCMC
Unpacking a bunch of related statistical concepts through visualization
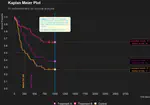
Animated KM
An experiment in storytelling using animation for statistical analysis
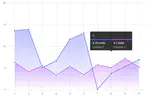
frappe Charts
My first attempt at porting a JS plotting library to R! Frappe Charts for all!
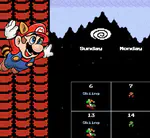
React Calendar
An reactable-based calendar and a whole lot of javascript and CSS
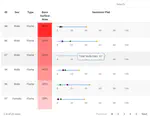
Survival Tables
Interactive survival analysis tables using DT and reactable display table packages
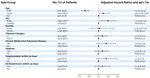
forestR
An interactive tool to create publication-quality forest plots
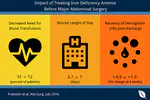
Visual Abstracts
Create a visual abstract to highlight your original research.
»
Cite
×