Table-based Data Visualizations using R
Abstract
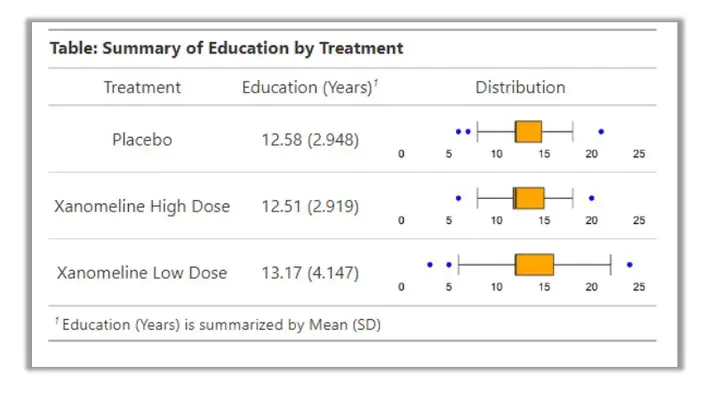
In this presentation, we investigate techniques for producing table-based data visualization using the R programming language. The primary goal is to enhance the medical review process by integrating inline, static or interactive visualizations directly into study tables or listings. This approach has the potential to elucidate study results by providing both a rich, compact view and profounder context of study data. Such insights may not be immediately obvious and could otherwise remain hidden in a strictly tabular summary. Specifically, we demonstrate how to construct inline variants of common clinical trial visualizations such as box plots, swimmer plots and heatmaps using various R table and visualization packages. Examples will stem primarily from oncology studies and include efficacy, lab and adverse event domains. Lastly, we discuss how these visualizations can be synergistically combined with Shiny ‘s native interactivity to produce web applications that further advance the medical review process.