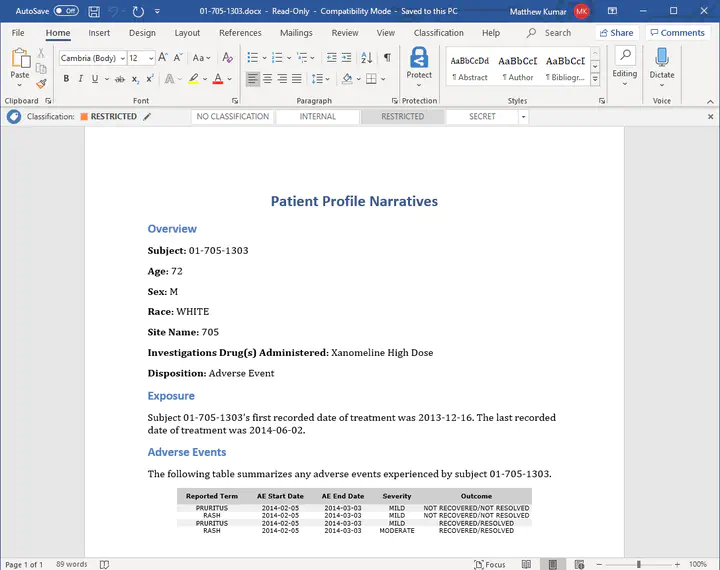
 An example MS Word patient narrative
I had recently learned about patient safety narratives, a key deliverable in clinical study reporting that is prepared on a per-patient basis. At the same time, I was also looking to extend my Rmarkdown knowledge to create automated workflows or “pipelines”. You can see where this is going right?
My aim was pretty clear: I wanted to create an Rmarkdown-based reporting engine, capable of automatically creating safety narratives for all participants in a clinical trial based on a single template.
For this example, I borrowed the clinical trial data from the PHUSE Github Repository, openly available here
Next, I got to work in seeing what data elements I would want to pick out for my narratives. I was less concerned with what’s actually in a narrative and more interested in the process of automating their creation. Nevertheless, I picked some elements that I think are relevant such as:
- Patient Age/Sex/Race
- Dates of first and last treatment
- Adverse Events, including reported term, severity, outcome and associated dates
The technical part of this project was interesting to think about and research. I ultimately decided with the following approach:
- Create a template or skeleton structure of a narrative that will be applied to each patients data
- The template includes data wrangling steps that will be repeated for each subject. In here, I also include a table object just to test out variety.
- Using Rmarkdown’s parameters (here each subject’s unique identifier), loop through the unique identifier list and have the corresponding report created.
This was great and I was able to get it to work almost immediately.
However…
I wanted extend the current approach by providing a user interface to the engine. This is especially useful for non-programming colleagues (or colleagues not familiar with R or Rmarkdown). Enter Shiny.
Briefly, the user experience can be described as:
- A list of patient identifiers are populated in a DataTable, and the user is instructed to select all or some of the patients they wish to generate a report for.
- The user then has the option to select the format of their narratives: .docx, .html, or .pdf
- Once selections are made, from here the process works similar to the above, but within the Shiny server context.
- The last step involves collecting all generated reports, bundling them into a single zip file, and returning them to the user as a download. While this process happens in real time, a progress bar is provided to the user as feedback.
That last part still amazes me.
I’ve since taken this a few steps further, investigating even more approaches (e.g. parent-child reports) and conditional execution of narrative text based on values of users data and including graphics. I will likely update this repo to include those enhancements, but for now enjoy as is!